Data Visualization
Example notebooks using data from OBIS
Here are a few R notebooks showcasing the robis package:
- Data exploration of wind farm monitoring datasets in OBIS
- Diversity of fish and vulnerable species in Marine World Heritage Sites based on OBIS data
- Data exploration - Stratified random surveys (StRS) of reef fish in the U.S. Pacific Islands
- DNADerivedData extension data access
- Canary Current LME
Here are others that may be of interest:
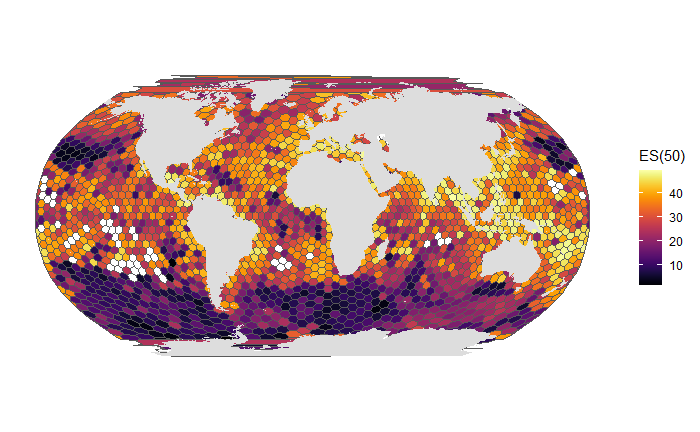
obisindicators: calculating & visualizing spatial biodiversity using data from OBIS
obisindicators is an R library developed during the 2022 IOOS Code Sprint. The purpose was to create an ES50 diversity index within hexagonal grids following the diversity indicators notebook by Pieter Provoost linked above. The package includes several examples, limited to 1M occurrences, that demonstrate uses of the package.